Late October Market Correction Update & Charts
Some new economic data is becoming available, which is allowing us to draw some conclusions on actions going forward, once this current market correction has recovered.
Up until Thursday of last week, this current market dip has generally been "orderly" even though the market has been moving rather quickly. What I mean by this comment is that the stock market's price has "stairstepped" its way downward throughout the day on most days, interrupted by upward rally attempts which, after a couple of days, have failed.
See-sawing prices throughout the trading day, even when the market closes lower, is a characteristic of a generally orderly market, with institutions merely re-positioning assets from stocks to bonds to create more predictable returns, as I discussed last time.
Yesterday, however, I was pleased to see, for the first time, panic-selling in the market, especially in the last hour of the day. "Pleased?" you might ask? Yes, I was pleased. You see - panic selling usually marks the end (or the near-end) of a stock market correction. The technical term for this is "capitulation" - when the last of the holdouts say "ok, I give up" and sell out - and the market then enters free-fall until it begins the "bottoming process" of the correction. A market "bottom" can take many forms' we have recently seen 2 "W" formations and one "consolidation triangle." At present, it is too early to see how this one will shape up, but so far, it appears it may be shaping up as an "inverse head and shoulders" pattern - which has 3 points at the bottom, with the middle point being the lowest, and which takes a few months to complete.
Are we there yet? No one knows for sure, and new news can always change things, but we can certainly hope. The latest data indicates that we are we are most certainly not currently in a recession, an a recession is not indicated for some time. Currently the economy is generally in good shape, midterm elections are around the corner, and earnings have been mixed but generally good. In fact, so far, 77% of companies reporting earnings have "beaten the Street" - in other words, performed better than their analysts expected. However, their future outlooks are not as rosy as before, with most CEO's concerned about tariffs, higher interest rates, and a rising dollar which makes US goods more expensive - and thus more difficult to sell overseas.
Even the most bearish market pundits (not including the tin-foil hats and the known crackpots) believe that this correction is at least 70-80% over, and all of them expect a strong rally over the next few months. So hang in there, no selling at the bottom and locking in losses...
Unless we do it for you, of course. Yesterday we entered trades to "harvest" tax losses in applicable accounts, replacing those securities with other positions that should behave similarly when the market rebounds. In other words, we used this correction to "capture" tax write-offs where we can, without hurting the opportunity to bounce back when the market rallies back. Of course, these operations were only performed in after-tax accounts, not in tax-deferred accounts such IRA’s, Roths, 401k’s.
What Comes Next
We are starting to see the fringes of the economy start to unravel a bit. While the big numbers that everyone reports are still strong, there are some easily overlooked data points "under the hood" of the economy that are beginning to point to a slowdown. For example:
New Building Permits are only fair, and the trend is worsening
New Durable Goods Orders are only fair but the trend is stable
Institute of Supply Management New Orders Index is fair, but worsening
The average workweek is shortening
New Employment of males age 25-54 fell by 30k
Forward looking earnings estimates have stopped rising, and corporate guidance is now tilted somewhat to the downside
Corporate insider selling has picked up sharply
Auto sales have weakened sharply
Key housing data has a weakening trend, despite a bump in this month's data
Globally, the Organisation for Economic Co-operation and Development (OECD)'s Leading Index is weakening
So... for those who have only heard me say "the economy is booming," you'll notice a slight shift in my tone. None of our Recession Prediction Algorithms suggest that recession is imminent, but this shift in data definitely coincides with the previous prediction that within a year or so, I would be surprised if we were not on the brink of recession, or already experiencing it. It would be a mistake to confuse slowing growth with recession; those are not the same thing - but from this point on, we can probably expect more volatility from the markets. This volatility may or may not be accompanied by great returns - sometimes the last year before a recession - even with slowing growth, the market returns over 20%; sometimes it doesn't.
However, at this time our plan is as follows:
Do nothing yet and be patient, keeping portfolios as they are to capture the rally that is likely to come next.
Once the market achieves its previous level, we plan to begin to shift portfolios to a less aggressive mix, such as weighting more toward value stocks, consumer staples, materials, utilities, and other sectors that tend to be less volatile during this later phase of the economic cycle.
Fine tune, train, and prepare to execute Recession Protocol.
Proactively keep you informed as this expansion phase draws to a close.
We are working diligently to keep abreast of events as they occur and appreciate your faith in our efforts. Have a great week!
Mid-term Elections Historical Market Behavior
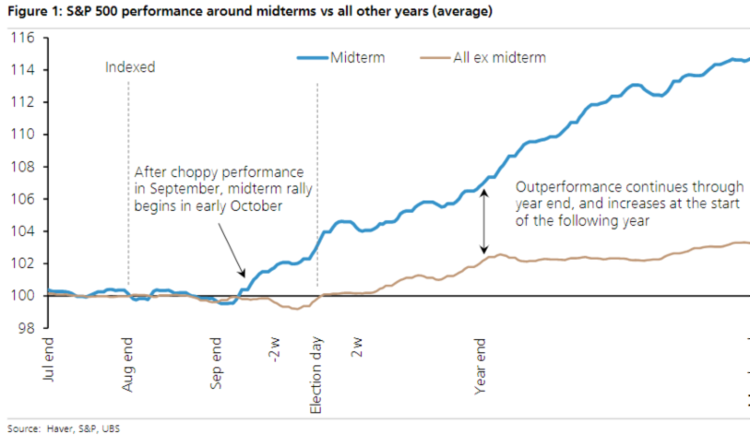
Mid-term Elections Historical Market Behavior
S&P500 1-Year Chart

S&P500 1-Year Chart
PLEASE SEE IMPORTANT DISCLOSURE INFORMATION